A chart helps you to read data in a better way. If you don’t know how to create a chart in Excel with a shortcut. Let’s start it and level up your Excel.
- Open an MS Excel on your Desktop or Laptop
- Type any data that you have, after that select the area, and you can create a chart in 2 ways as below.
a) You can go to Insert and then select the chart of your choice or
b) Excel shortcut alt+f1
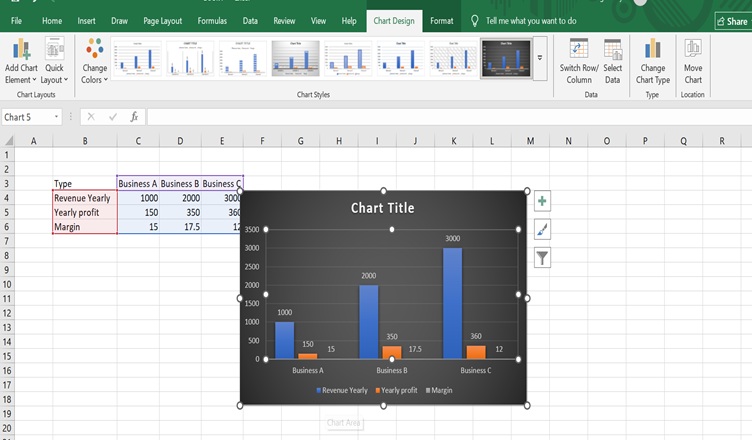
Once the Chart is created, you can change the type of the Chart from the chart design as shown in the image. You can select the design depending on your business.
Note: Do not forget to name the chart by clicking the chart title.
A chart can be used for analysing the growth, business meetings, or presentations.
Hemant is Digital Marketer and he has 6 + years of experience in SEO, Content marketing, Infographic etc.